Before embarking on the coding process for a program, it’s essential to strategize the step-by-step approach for accomplishing the intended task. This strategic plan can be visually articulated through the use of a diagram known as a flowchart. Essentially, a flowchart serves as a symbolic representation of the solution to a given task. It’s a versatile tool applicable to a wide range of jobs.
Flowcharting facilitates the graphical depiction of program logic sequences. By visually mapping out the sequence of operations, flowcharting allows us to conceptualize the program’s logic flow comprehensively. Moreover, it serves as a preemptive measure to identify and rectify any logical or other errors before the actual coding phase commences. In essence, flowcharting is a crucial preliminary step in the programming process, aiding in the clear delineation of program logic and error detection.
Definition of flowchart
A flowchart in programming is a graphical representation of the logical flow or sequence of steps in a program’s execution. It uses standardized symbols and shapes to depict various actions, decisions, and processes within the program. Flowcharts serve as visual aids to help programmers understand, plan, and communicate the structure and logic of their code. They can range from simple diagrams outlining basic processes to complex charts detailing intricate algorithms. Flowcharts play a crucial role in software development by providing a clear and concise overview of the program’s functionality, allowing for easier debugging, maintenance, and collaboration among team members.
TYPES OF FLOWCHARTS
- Program Flowcharts
- System Flowcharts
Program Flowcharts
A flowchart in programming is like a map that programmers use to understand how a program works. It shows the structure of the program, the order in which different actions happen, and what happens at each step. Think of it as a visual guide that outlines the journey of your program from start to finish.
Here’s what you’ll typically find in a program flowchart:
- Program Structure: This outlines how the program is organized, like the different parts and how they fit together.
- Program Logic: It shows the logical flow of the program, meaning how one action leads to another.
- Data Inputs: These are the pieces of information that the program takes in at different stages.
- Data Processing: This is where the program does its work—processing the data, making calculations, and so on.
- Conditions and Decisions: It indicates the points where the program makes decisions based on certain conditions.
- Branching and Looping: This shows where the program might go in different directions or repeat certain steps.
- Results and Outputs: It displays what the program produces as a result, like final calculations or messages to the user.
In a nutshell, a program flowchart focuses on explaining how the program’s logic works, making it easier for programmers to understand and work with the code.
System Flowcharts
Think of a flowchart as a roadmap for building a computer program. It’s like drawing a picture of how you want your program to work before actually writing any code. This helps programmers focus solely on the problem-solving logic without worrying about the specific programming language details.
Here’s how it works:
- Planning with Flowcharts: Programmers start by sketching out a flowchart, which shows the logical steps of the program in a visual way. This step is independent of any programming language, allowing full concentration on solving the problem at hand.
- Translating to Code: Once the flowchart is complete, programmers translate it into a programming language. They can now focus on translating each step of the flowchart into actual code without worrying too much about the logic, as that’s already been figured out.
- Flowchart Symbols: Flowcharts use different shapes like boxes to represent different types of instructions or actions. Each box contains the specific instruction or action. These boxes are connected by lines with arrowheads to show the flow or sequence of the program. These symbols have standardized meanings set by the American National Standards Institute (ANSI).
Here are some key points to remember when using flowchart symbols:
- Shape Matters: The shape of the symbol is important and should not be changed.
- Size Flexibility: You can adjust the size of the symbols as needed.
- Recognition: Symbols should be easily recognizable at a glance.
- Legibility: Any details inside the symbols should be clear and easy to read.
- Flow Lines: Try to keep flow lines from crossing whenever possible, to maintain clarity.
Using flowcharts helps beginners understand and plan their programs before diving into coding. They also prove useful during testing and making changes to the program later on.
Terminal Symbol
Think of a flowchart like a journey. Every journey has a beginning and an end, right? In a flowchart, the beginning is marked with a special symbol called the “Start” terminator, which is where the flowchart begins. You’ll usually see the word “START” inside this symbol.
Similarly, every journey needs to come to an end, and in a flowchart, that’s represented by the “Stop” terminator. This is where the flowchart ends, and you’ll typically find the word “STOP” inside this symbol.
It’s important to note that you can only have one “Start” and one “Stop” terminator in your entire flowchart. Just like a story has a single beginning and a single ending, a flowchart follows the same rule.
Sometimes, a program might need to pause for a moment before continuing. In such cases, we also use a terminal symbol to indicate this pause in the flowchart.
Input/Output Symbol
Think of this symbol like a doorway where information comes in or goes out of your program. It’s called the Input/Output symbol, and it represents any action involving input from or output to devices like keyboards, printers, monitors, and more.
So, if your program needs to take information from a keyboard, a card reader, or any other input device, you’ll use this symbol to show that interaction. Similarly, if your program needs to send information to a printer, a monitor, or any other output device, you’ll also use this symbol to represent that action.
In short, the Input/Output symbol acts as a gateway for information to flow into or out of your program, depending on what it needs to do.
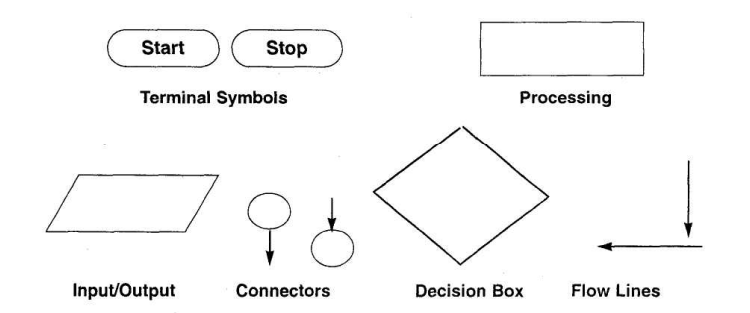
Process Symbol
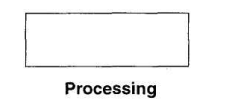
A process symbol is used to represent arithmetic and data movement instructions in the flowchart. All arithmetic processes of addition, subtraction, multiplication and division are indicated in the process symbol. The logical process of data movement form one memory location to another is also represented in the process box. If there are more than one process instructions to be executed sequentially, they can be placed in the same process box, one below the other in the sequence in which they are to be executed.
Decision Symbol
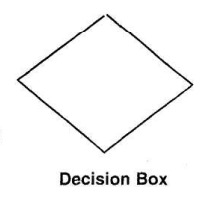
The decision symbol is used in a flowchart to indicate the point where a decision is to be made and branching done upon the result of the decision to one or more alternative paths. The criteria for decision making is written in the decision box. All the possible paths should be accounted for. During execution, the appropriate path will be followed depending upon the result of the decision
Flowlines
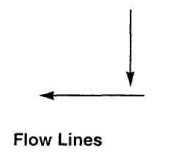
Flowlines are solid lines with arrowheads that indicate the flow of operation. They show the exact sequence in which the instructions are to be executed. The normal flow of the flowchart is depicted from top to bottom and left to right.
Connectors
In situations, where the flowcharts become large, the flowlines may start crossing each other at many places, confusing. This will also result in making the flowchart difficult to understand. Also, the flowchart may not fit on a single page for big programs. Thus, whenever the flowchart becomes complex and spreads over several pages, connectors are used.
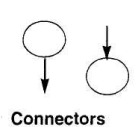
The connector represents entry from or exit to another part of the flowchart. A connector symbol is indicated by a circle and a letter or a digit is placed in the circle. This letter or digit indicates a link. A pair of such identically labeled connectors is used to indicate a continued flow in situations where flowcharts are complex or spread over more than one page. Thus, a connector indicates an exit from some section in the flowchart and an entry into another section of the flowchart. If an arrow enters a flowchart but does not leave it, it means it is an exit point in the flowchart, and program control is transferred to an identically labeled connector with an outlet. This connector will be connected to the further program flow from the point where it has exited. Connectors do not represent any operation in the flowchart. Their use is only for increased convenience and clarity.
ADVANTAGES OF FLOWCHARTS
Using flowcharts in problem-solving offers several advantages for programmers:
- Visual Representation of Program Logic: Flowcharts serve as powerful tools for representing program logic graphically, allowing programmers to develop and visualize the sequence of operations independently of any programming language.
- Developing Program Logic and Sequence: Programmers can start by creating a macro flowchart to outline the main logic of the software. This can then be further broken down into smaller, more detailed parts for in-depth analysis and study.
- Ease of Explanation: Flowcharts provide a clear, pictorial representation of a program’s logic, making it easier for programmers to explain the program’s functionality to others, especially those unfamiliar with programming languages.
- Modularity in Development: In real-life programming scenarios, multiple programmers may work on different parts of a system. Each programmer can develop their own flowchart for their specific task, which can later be combined to depict the overall system structure. This allows for early detection of module linking issues and facilitates necessary modifications.
- Documentation: Flowcharts contribute to strong documentation of the software system, aiding in its overall understanding and maintenance.
- Ease of Program Writing: Once a flowchart is complete, translating it into a program becomes straightforward. Since the flowchart details the program logic comprehensively, programmers are less likely to miss steps during actual program writing, resulting in error-free code. This also speeds up the development process.
- Debugging Assistance: Flowcharts play a crucial role in the debugging process. They help programmers systematically detect and correct bugs, ensuring smoother program execution.
- Effective Testing Tool: Flowcharts facilitate effective testing by allowing programmers to input different data sets into the program and observe its behavior, aiding in identifying potential issues and refining program functionality.
DEVELOPING FLOWCHARTS
When developing flowcharts, several key considerations should be taken into account:
- Defining the Problem: Clearly define the problem that the program aims to solve. Understanding the problem is crucial for designing an effective solution.
- Identifying Steps for Solution: Break down the problem into smaller, manageable steps. Each step should contribute towards achieving the overall solution.
- Determining Input and Output Parameters: Identify the inputs required for the program to function correctly, as well as the desired output parameters that the program should produce.
- Expected Data Values and Output Results: Determine the expected data values for the input parameters and anticipate the desired results or outputs that the program should generate.
- Computations and Decisions: Analyze the computations and decisions involved in solving the problem. Identify any calculations or logical steps necessary for the program’s execution.
With this understanding of flowcharts and their symbols, let’s proceed to create some sample flowcharts. We’ll first outline the steps for preparing the flowchart for a specific task, followed by drawing the actual flowchart. This systematic approach ensures clarity and coherence in representing the program logic visually.
Example: Let’s consider the task of preparing a flowchart to add two numbers (see Fig. 2a).
The steps involved in creating this flowchart are as follows:
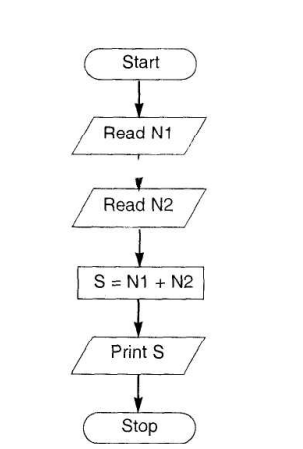
- Start: This is the starting point of the flowchart, where the program execution begins.
- Get two numbers N1 and N2: The flowchart should include a step to prompt the user to input two numbers, which we’ll call N1 and N2. These numbers will be used for addition.
- Add them: After obtaining the input numbers, the flowchart should include a step to add these two numbers together.
- Print the result: Once the addition is performed, the flowchart should include a step to display or print the result of the addition operation.
- Stop: Finally, there should be a termination point in the flowchart where the program execution ends.
By following these steps, the flowchart effectively represents the logic required to add two numbers, providing a visual roadmap for program execution.
Example: Let’s consider the task of preparing a flowchart to determine the greatest of two numbers.
Here’s how we can create this flowchart:
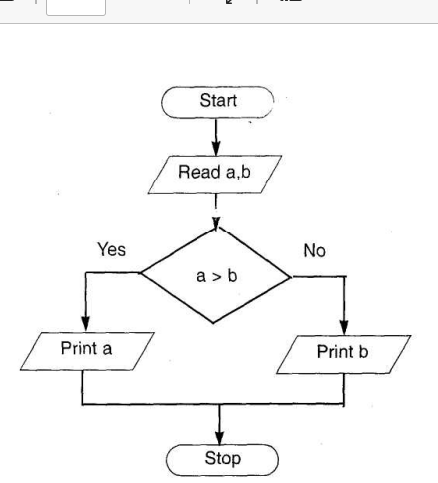
- Start: Begin the flowchart at the starting point.
- Get two numbers A and B: We can combine the input of both numbers A and B into a single box. This box represents the step where the program prompts the user to input two numbers.
- Decision: We use a decision symbol to compare the values of A and B. If A is greater than B, the flow of the program goes one way; if not, it goes another way.
- Print the greater number: Depending on the result of the decision, we print either A or B, indicating which number is greater.
- Stop: End the flowchart at the stopping point.
It’s important to note that in the second example, we combined the input of both numbers A and B into a single box to streamline the flowchart. This demonstrates that if multiple instructions of the same kind follow one another, they can be combined into a single box for clarity and simplicity.
TECHNIQUES to make Flowcharts
In this section, we will explore various flowcharting techniques, including:
- Flowcharts for computations
- Flowcharts for decision making
- Flowcharts for loops
- Predefined Process
Flowcharts for Computations:
Computers are adept at performing calculations swiftly. Consequently, when developing a program, it often involves executing numerous calculations. The general steps for flowcharting computations are as follows:
- Create Memory Variables: Set up memory variables (memvars) required for calculations and input operations.
- Obtain Data Input: Gather the necessary input data using the memory variables.
- Perform Calculations: Execute the requisite calculations using the input data and memory variables.
- Print the Result: Display or output the computed result.
When employing computation techniques in programming, certain considerations should be taken into account:
- Memory Variable Creation: Most programming languages provide mechanisms for creating memory variables. However, the specific syntax may vary depending on the language in use. It’s crucial to initialize these memory variables before utilizing them in the program, although this requirement may not apply universally across all programming languages.
Let’s illustrate the usage of flowcharts in computations through the following examples:
The accompanying flowcharts can be found in Fig. 3a and Fig. 3b.
These flowcharts exemplify the process of executing computations in a program, showcasing the sequential steps involved in performing calculations and obtaining the desired results.
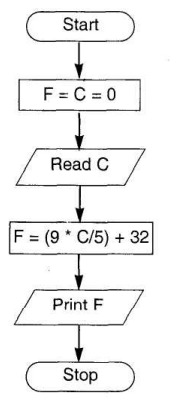
Example: Let’s create a flowchart for a program that converts temperature from degrees Celsius to degrees Fahrenheit.
Here are the steps involved in this computation technique:
Start: Begin the flowchart at the starting point.
Create Memory Variables: Initialize memory variables F (for temperature in Fahrenheit) and C (for temperature in Celsius).
Read Degrees Celsius: Prompt the user to input the temperature in degrees Celsius and store it in the variable C.
Compute Degrees Fahrenheit: Calculate the equivalent temperature in degrees Fahrenheit using the formula .
Print Result: Display or output the result, which is the temperature in degrees Fahrenheit (variable F).
Stop: End the flowchart at the stopping point.
This flowchart illustrates the process of converting temperature from Celsius to Fahrenheit, depicting each step involved in the computation technique.
degrees Celsius to degrees Fahrenheit.
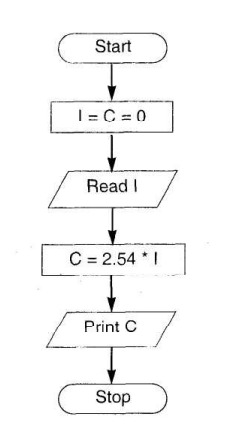
Example: Let’s create a flowchart for a program that converts inches to centimeters.
Here’s how we can outline the steps involved in this computation technique:
Start: Initiate the flowchart at the starting point.
Create Memory Variables: Set up memory variables C (for centimeters) and I (for inches).
Read Value of Inches: Prompt the user to input the value in inches and store it in the variable I.
Compute Centimeters: Calculate the equivalent length in centimeters using the formula .
Print Result: Display or output the result, which is the length in centimeters (variable C).
Stop: Conclude the flowchart at the stopping point.
This flowchart delineates the process of converting inches to centimeters, elucidating each step involved in the computation technique.
Flowcharts for Decision Making:
Computers play a crucial role in various types of analyses, and flowcharts utilize decision symbols to signify these decision-making processes. Here’s the general format of steps for flowcharting decisions:
- Perform the Test of the Condition: Evaluate a specific condition to determine its truth or falsehood.
- If Condition Evaluates True: If the condition evaluates to true, the flow branches to the steps labeled “Yes.”
- If Condition Evaluates False: If the condition evaluates to false, the flow branches to the steps labeled “No.”
Programming Considerations:
Most programming languages provide commands for performing tests and branching, but the exact commands and syntax vary between languages. Some common conditional constructs used for implementing decision-making in programs include:
- If statements
- If-else statements
- If-elseif statements
- Do case-endcase statements
- Switch statements
Not all languages support all of these constructs. Additionally, operators such as relational operators (for determining equality or inequality) and logical operators (for combining expressions) are available for implementing the decision test.
Branching to another set of commands can be achieved through functions, procedures, or similar constructs in the programming language. This flexibility allows programmers to implement decision-making logic efficiently within their programs.
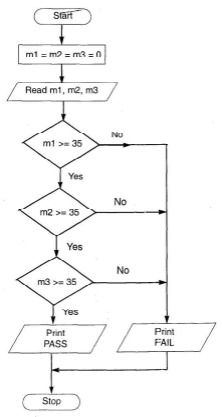
Example: Let’s create a flowchart to determine a student’s result based on marks obtained in three subjects.
Here are the steps involved in this process:
- Start: Begin the flowchart at the starting point.
- Create Memory Variables: Initialize memory variables m1, m2, and m3 to store marks obtained in three subjects.
- Read Marks of Three Subjects: Prompt the user to input the marks for each subject and store them in the respective variables m1, m2, and m3.
- Check Marks for Subject 1: If the marks obtained in subject 1 (m1) are greater than or equal to 35, proceed to step 5; otherwise, proceed to step 7.
- Check Marks for Subject 2: If the marks obtained in subject 2 (m2) are greater than or equal to 35, proceed to step 6; otherwise, proceed to step 7.
- Check Marks for Subject 3: If the marks obtained in subject 3 (m3) are greater than or equal to 35, print “Pass” and proceed to step 8.
- Print “Fail”: If any of the subjects have marks below 35, print “Fail.”
- Stop: End the flowchart at the stopping point.
This flowchart illustrates the process of determining whether a student passes or fails based on their marks in three subjects, demonstrating each step involved in the decision-making process.
An alternative method involves combining all conditions using the AND operator. Here are the steps for this approach:
- Start: Begin the flowchart at the starting point.
- Create Memory Variables: Initialize memory variables m1, m2, and m3 to store marks obtained in three subjects.
- Read Marks of Three Subjects: Prompt the user to input the marks for each subject and store them in the respective variables m1, m2, and m3.
- Check Marks for Passing: Use the AND operator to check if all three subjects have marks greater than or equal to 35. If so, print “Pass”; otherwise, proceed to step 5.
- Print “Fail”: If any of the subjects have marks below 35, print “Fail.”
- Stop: End the flowchart at the stopping point.
Developing this flowchart is left as an exercise for the student. This method provides an alternative approach to determining whether a student passes or fails based on their marks in three subjects.
Flowcharts for loops
Looping refers to the repetitive execution of one or more steps, where a statement or block of statements within the loop is executed multiple times. There are two main types of loops:
- Fixed Loop: In a fixed loop, operations are repeated a predetermined number of times. The number of iterations is fixed and does not depend on the values of variables within the loop.
- Variable Loop: In a variable loop, operations are repeated until a specific condition is met. Here, the number of iterations can vary based on the condition being evaluated.
The general process of a loop includes the following steps:
- Setting and Initializing a Counter: Establishing and initializing a counter variable to control the number of iterations.
- Execution of Operations: Performing the desired operations within the loop.
- Testing Completion of Operations: Checking whether the loop has completed its iterations or if a specified condition has been met.
- Incrementing the Counter: Increasing or updating the counter variable to progress through the loop.
The test for completion can involve determining whether the loop has executed a certain number of times or if a specified condition has been satisfied. This process allows for efficient repetition of tasks in programming, enabling automation and streamlining of operations.
Programming considerations
Most programming languages offer various loop constructs to effectively manage repetitive statements in a program. Some common loop constructs include:
- do-while loop: Executes a block of code repeatedly until a specified condition becomes false. The condition is evaluated after each iteration.
- while loop: Repeatedly executes a block of code as long as a specified condition is true. The condition is evaluated before each iteration.
- for loop: Iterates over a sequence of values, typically used when the number of iterations is known beforehand. It consists of three parts: initialization, condition, and increment/decrement.
- for-next loop: Similar to the for loop, it iterates over a sequence of values, but typically in a predefined range. It is commonly used in languages like BASIC.
In many looping scenarios, counters are utilized to keep track of the number of iterations. When loops are based on conditions, relational operators are employed to evaluate these conditions. These constructs provide programmers with versatile tools for efficiently managing repetitive tasks within a program, enhancing productivity and code readability.
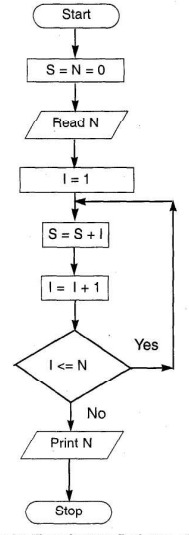
Example: Let’s consider finding the sum of the first N numbers. This example demonstrates the use of a loop for a specific number of iterations.
Here are the steps involved:
- Start: Begin the flowchart at the starting point.
- Create Memory Variables: Initialize memory variables S (for sum), N (for the total number of terms), and I (for the counter).
- Read N: Prompt the user to input the value of N.
- Initialize Sum: Set the sum variable (S) to 0.
- Initialize Counter: Set the counter variable (I) to 1, indicating the start of the loop.
- Update Sum: Add the current value of the counter (I) to the sum (S).
- Increment Counter: Increment the counter (I) by 1 to progress through the loop.
- Check Condition: Verify if the counter (I) is less than or equal to N. If true, repeat steps 6 to 8; if false, proceed to step 9.
- Print Sum: Output the final sum (S).
- Stop: End the flowchart at the stopping point.
This flowchart illustrates the process of calculating the sum of the first N numbers, utilizing a loop to iterate through the specified number of terms. It showcases each step involved in the iterative process, ultimately producing the desired result.
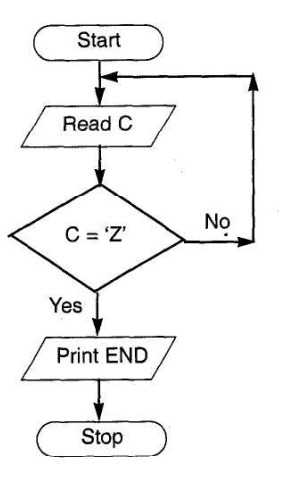
Example: Let’s consider checking whether a character read from the keyboard is ‘Z’. If the character is ‘Z’, we print “END”; otherwise, we continue reading another character. This example illustrates a test that executes until a specific condition is met.
Here are the steps involved:
- Start: Begin the flowchart at the starting point.
- Create Memory Variable: Initialize a memory variable C to store the character read from the keyboard.
- Read Character (C): Prompt the user to input a character and store it in variable C.
- Check Condition: Test whether the value of C is equal to ‘Z’. If the condition is false, proceed to step 5; otherwise, repeat step 3.
- Print “END”: If the character read is ‘Z’, print “END” to signify the end of the program.
- Stop: End the flowchart at the stopping point.
This flowchart demonstrates the process of repeatedly checking whether a character input from the keyboard is ‘Z’. If the condition is met, the program prints “END”; otherwise, it continues to prompt the user for input until the condition is satisfied.
Predefined Process
In large-scale applications, we often rely on programs written by others or utilize library routines provided by programming languages. These library routines are examples of predefined processes. In a predefined process, the inputs required and the expected output are known, but the internal workings of the routine are hidden from the user, resembling a black box.
Predefined processes offer several advantages:
- Time-saving: They enable us to leverage existing programs and routines, saving a significant amount of time in software development.
- Integration: Predefined processes facilitate the integration of various software components into a cohesive unit, enhancing the overall functionality of the application.
- Versatility: Predefined routines can be seamlessly incorporated into different parts of a flowchart, serving as single symbols representing entire processes developed elsewhere.
In terms of programming considerations:
- Structured and Modular Programming: Modern software development practices emphasize structured and modular programming. Each module within a software application can treat other modules as predefined processes, promoting code reusability and maintainability.
- Library Routines Development: When developing library routines, the concept of predefined processes is integral. By encapsulating common functionalities into predefined routines, developers can avoid redundant coding efforts and ensure consistency across multiple applications.
Overall, predefined processes play a crucial role in streamlining software development efforts, reducing redundancy, and fostering code reuse across diverse applications.